![]()
Moving Energy Forward
Case Studies

LNG Carbon Accounting
As part of Gunvor’s commitment to understanding and addressing the carbon impact and environmental risks associated with its physical trading activities, the company has been working with CarbonChain to calculate the GHG emissions for its entire LNG trade portfolio for 2020 and 2021. It was critical for this data to cover every stage of the supply chain—including source, production, transport, and combustion—to provide comprehensive insight into Gunvor’s carbon hotspots and opportunities for improvement.
After gathering and exporting Gunvor’s raw supply chain data, within three months CarbonChain produced a comprehensive supply chain carbon footprint, carbon intensity calculations for Gunvor’s LNG portfolio, and trade-by-trade and asset-level analyses.
Unlike broad-based estimates, Gunvor’s reports contain accurate and verifiable data based on CarbonChain’s independent and auditable methodology and bottom-up emissions database.
Key Results
In 2020, 94 trades were assessed (covering 6.80 million tonnes of LNG), and 122 in 2021 (covering 8.02 million tonnes). The emissions are broken down according to source, assets, and destination countries, with temporal analyses (quarterly and annual). Results include:
All greenhouse gas emissions represented as tonnes of carbon dioxide equivalents (tCO2e).
Ongoing accounting of Gunvor’s LNG trade emissions allows Gunvor to pinpoint legislative, reputational, and financial risk, measure progress and identify reduction opportunities. Given the notorious difficulty of obtaining emissions information for natural gas supply chains, it’s likely that Gunvor is one of the first commodity traders to have mapped out its LNG carbon footprint, risks, and opportunities at this level of granularity and accuracy.
LNG – Summary – 2021
110
Total number of assessed trades
8.25M
Quantity of traded commodity (tonne)
30.88M
Total emissions of assessed trades (tCO2e)
3.74
Average carbon intensity of a trade (tCO2e7t)
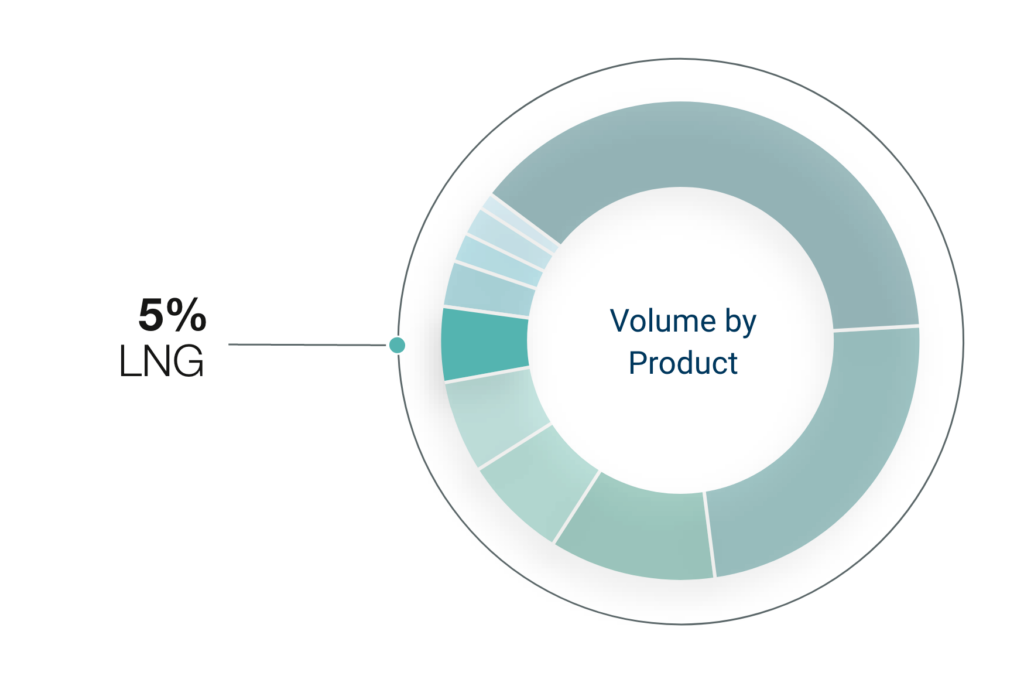
Profile of trade supply chain emissions
Average carbon intensity by source country [tCO2e/t]